How Can Retailers Use Footfall Analytics to Increase Sales?
 7 minutes read
 01/07/26
 Tapway
Introduction — The Problem
Footfall analytics turns raw visitor counts into actionable business intelligence. Unlike simple foot traffic counting, footfall analytics tracks who visits, when, where they go, and how they behave — enabling retailers to optimize staffing, inventory placement, store layout, and marketing spend based on real data rather than guesswork.
Here’s how footfall analytics works and how leading retailers are using it to drive measurable sales growth.
Why This Matters Now
With rising operational costs and tighter margins, retailers can no longer afford to make decisions based on intuition. The global footfall analytics market is projected to reach $3.2 billion by 2028 (MarketsandMarkets, 2025), driven by demand for data-driven store operations. Retailers using footfall analytics report 15–25% increases in conversion rates and up to 20% reduction in staffing costs through optimized scheduling.
What Is Footfall Analytics?
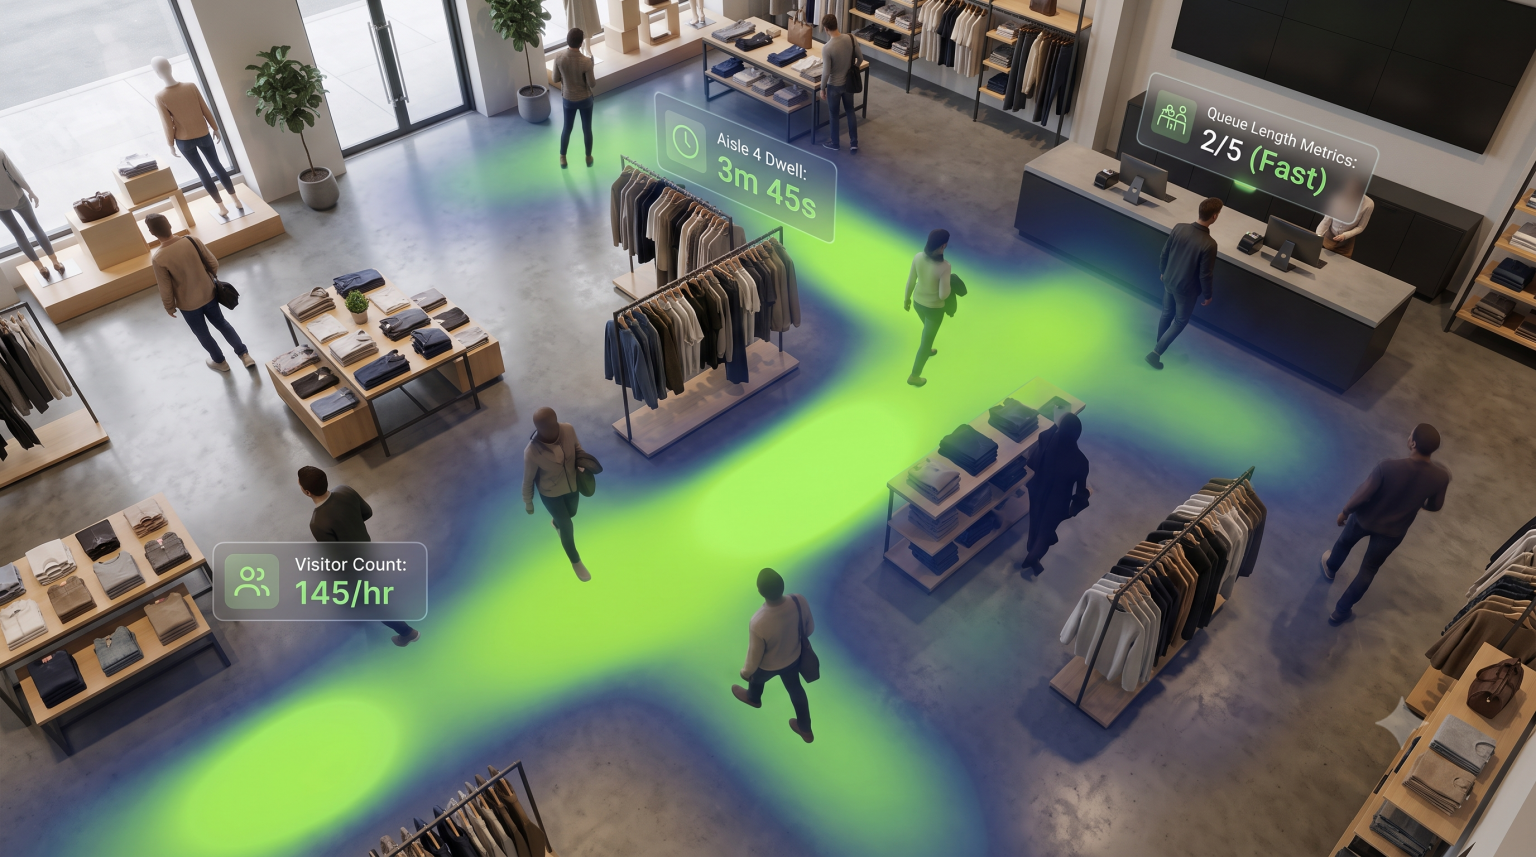
Footfall analytics is the technology that uses computer vision or sensor data to count, track, and analyze visitor movement patterns in physical retail spaces. Unlike a simple door counter that records entries, footfall analytics captures rich behavioral data: dwell time per zone, queue lengths, aisle traffic patterns, heat maps of customer movement, and conversion rates from passerby to visitor to buyer.
Modern systems use AI-powered cameras connected to a central dashboard, providing real-time data plus historical trends across all store locations.
How Footfall Analytics Works
- Capture: AI-enabled cameras or 3D sensors detect people entering, moving through, and exiting the store.
- Process: On-device AI anonymizes each person into a data point, tracking movement without storing identifiable features.
- Analyze: The system maps traffic density, dwell time per zone, queue formation, and conversion funnel (window → entry → browse → purchase).
- Report: Dashboards and alerts surface actionable insights — peak hours, underperforming zones, staffing gaps — in real time.
Key Benefits & Use Cases
Footfall analytics delivers measurable business value across several dimensions. The most impactful use cases combine traffic data with sales data for a complete picture of store performance across three critical areas.
Use Case 1: Optimized Staff Scheduling
Retailers using footfall analytics to schedule staff report 15–20% lower labor costs without sacrificing service quality (McKinsey, 2025). By matching staffing levels to actual traffic patterns rather than historical averages, stores avoid overstaffing during slow periods and understaffing during peak hours. Tapway’s Vision AI platform provides real-time traffic dashboards so store managers can adjust schedules dynamically across shifts.
Use Case 2: Improved Store Layout & Merchandising
Heat maps from footfall analytics reveal which floor zones attract the most traffic and which are dead zones. One fashion retailer rearranged their layout based on traffic data and saw a 12% lift in sales per square foot within 60 days (Deloitte, 2025). Footfall data also determines optimal product placement — high-margin items go in high-traffic zones, complementary products along natural customer paths — turning floor planning from art into science.
Use Case 3: Data-Driven Marketing Attribution
By correlating foot traffic spikes with specific marketing campaigns, retailers can calculate true ROI per channel. A promotional email that drives a 20% traffic increase is clearly working; one that doesn’t needs rethinking. Footfall analytics closes the attribution loop that online retailers have always had but physical stores have lacked — making every marketing dollar measurable and every campaign accountable.
Industry Data & Stats
- 65% of retailers now use some form of footfall analytics, up from 38% in 2022 (Juniper Research, 2025).
- 15–25% conversion lift: Retailers actively using footfall data report conversion rate improvements within the first year.
- $3.2B market: The global retail analytics market is projected to reach $3.2 billion by 2028, growing at 18.4% CAGR.
- 20% staffing savings: Data-driven scheduling reduces labor costs while maintaining customer satisfaction scores.
- 82% of shoppers say queue wait time directly affects their likelihood to return, making queue monitoring a critical footfall use case.
How Tapway’s Vision AI Powers Footfall Analytics
Tapway’s Vision AI platform transforms existing CCTV cameras into intelligent footfall analytics sensors. The system counts visitors with 98%+ accuracy, generates heat maps of in-store movement, tracks queue length and wait times, and provides a unified dashboard across every store location — no new hardware required.
Unlike sensor-based systems that demand costly installations, Tapway works with cameras already deployed. Edge AI processing ensures privacy compliance — no facial recognition, no personal data stored. Retailers get granular traffic intelligence without the infrastructure cost or privacy concerns that have historically slowed adoption.
Real Results: One Retailer’s Story
A Southeast Asian retail chain with 45 stores deployed Tapway’s footfall analytics across all locations. Within 90 days, they identified that 30% of stores had peak-hour staffing gaps causing 40% of customers to abandon before purchasing. After adjusting schedules using footfall data, the chain saw a 22% increase in conversion rate across the worst-performing stores and an 18% reduction in labor costs — a combined annual impact of over $2M.
Getting Started with Footfall Analytics
Getting started with footfall analytics is simpler than most retailers expect:
- Audit existing cameras: Most stores already have suitable cameras — no new hardware needed in 80%+ of deployments.
- Connect to an AI platform: Tapway installs in days, not months, connecting directly to existing IP cameras.
- Set baseline metrics: Two weeks of data establishes traffic patterns, peak hours, and conversion baselines per store.
- Act on insights: Schedule staff, adjust layouts, and measure marketing impact based on real traffic data — not hunches.