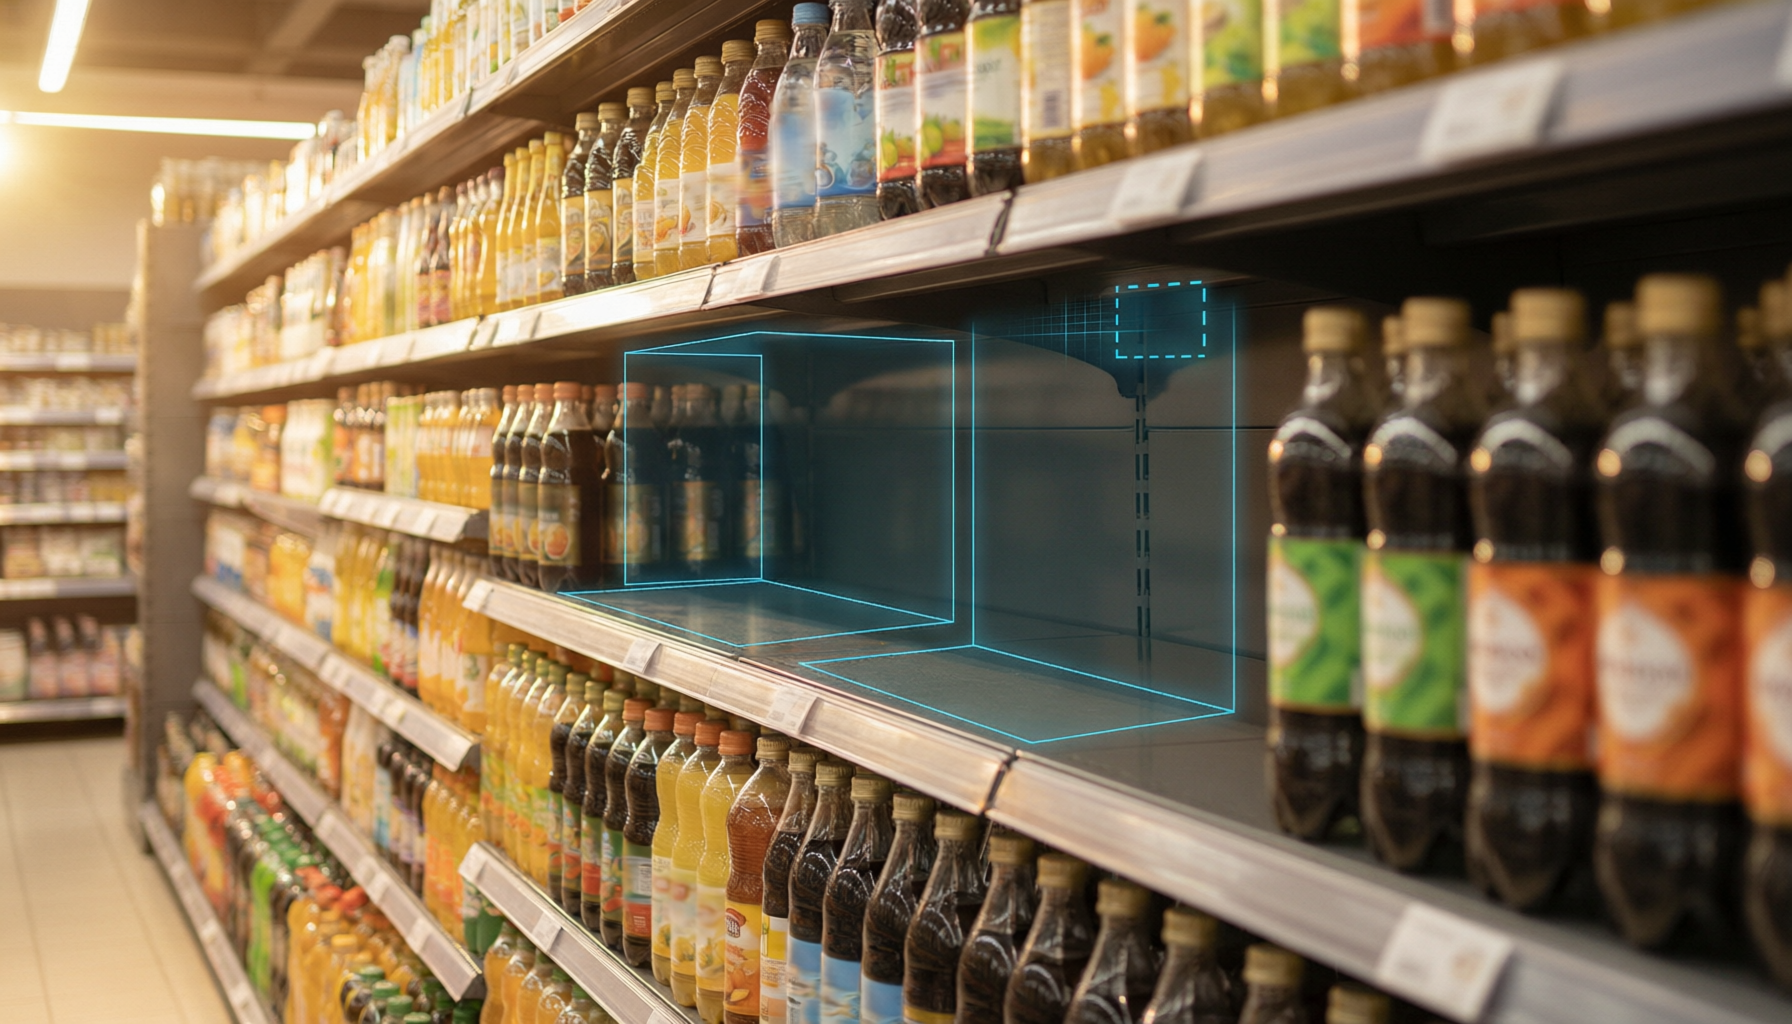
On-shelf availability (OSA) is the share of planned products a shopper can actually find on the shelf at the moment they look. It is not the same as inventory accuracy. A store can hold the stock and still fail, because the item sits in the backroom or hides behind a blocked facing. AI vision measures OSA directly from shelf cameras: it compares detected facings against the planogram, timestamps every gap, and routes a restock task before the shopper gives up.
Executive Summary
Clipboards, POS exceptions and audits have measured shelf gaps for decades with little movement in the headline number. IHL Group’s 2025 Shelf Intelligence Report finds retailers self-report 58% average on-shelf availability, with fewer than 22% clearing 80% compliance. Camera-based monitoring turns that weekly sample into a continuous census, attaching gap duration and recovery time to every SKU zone.
- Out-of-stock runs near 8.3% globally, and about 43% of incidents cost the retailer money (ECR Retail Loss).
- 66% of shoppers who hit an empty shelf take the basket to another retailer (AlixPartners).
- 74% rank availability as their top in-store priority, above price and promotions (SPAR Group, 2025).
- Cadence, not restock speed, is the binding constraint: you cannot fix gaps you count once a week.
Entity tags: on-shelf availability, out-of-stock detection, AI shelf monitoring, computer vision, planogram compliance, retail inventory accuracy, shelf gap analytics
The Current State of On-Shelf Availability in Retail in 2026
The 2025 IHL study, run with Brain Corp, surveyed executives at large US retailers and found the problem structural rather than seasonal. 67% report inventory problems weekly or constantly, 65% describe the strain as moderate to extreme, and 88% want checks weekly or more often — a cadence no manual audit programme can sustain. What changed is the toolkit: fixed cameras and edge inference deliver per-bay gap events without a robot in the aisle — useful, since the same SPAR survey found 71% of shoppers are uncomfortable or unsure about roaming robots.
How On-Shelf Availability Is Measured
OSA is a ratio: facings a shopper can buy divided by facings the planogram says should be there, sampled across bays, categories and hours. Four metrics get conflated in practice: availability, planogram compliance, promotional compliance and record accuracy. A shelf can be fully compliant and still empty, or stocked with the wrong variant.
AI vision builds the measurement in four steps. Each camera is calibrated to bays and facings, so a pixel maps to a physical position. Detection classifies shelf state: product present, genuine gap, blocked facing or misplaced item. Each gap event carries start and end timestamps, yielding gap duration, OSA by bay and hour, and recovery time after a restock task. The same events expose phantom inventory and feed a phone-based task queue. Unlike POS data, which only reveals items that failed to scan, vision sees gaps in products nobody bought that day.
Industry Evidence: 2026 On-Shelf Availability Benchmarks
Baseline loss: Corsten and Gruen’s ECR study still anchors the field with an average global out-of-stock rate of 8.3% (8.6% in Europe); 43% of incidents cost the retailer money, and halving the rate lifts sales 1.8% and net income 18%. Cause distribution: store ordering and stocking account for 38% of incidents, ahead of supplier failures, which is why in-store measurement matters. Self-reported accuracy: IHL’s 2025 work puts average on-shelf availability at 58%, with fewer than 22% of large US retailers above 80% compliance. Consumer response: 66% take an out-of-stock basket to another retailer (AlixPartners). Market scale: inventory distortion costs $1.73 trillion a year, or 6.5% of global retail sales, and IHL projects computer vision adoption in retail to grow 8,143% over two years.
Comparative Analysis: Eight Ways to Measure Shelf Availability
| Method | What It Captures | Blind Spots | Refresh Cadence |
|---|---|---|---|
| Manual shelf audit | Facings, gaps, planogram drift | Sampling error, labour cost, store-to-store variance | Weekly to quarterly |
| POS sales exceptions | Items scanning below forecast | Cannot see gaps in products never sold | Daily |
| Perpetual inventory and cycle counts | Record accuracy against physical stock | Sees backroom, not shelf presentation | Weekly to monthly |
| RFID item tagging | Unit-level location and movement | Tag cost, category fit, read gaps | Continuous where deployed |
| Robot shelf scanning | Aisle images on scheduled passes | Aisle disruption, capex, coverage windows | Daily to weekly |
| Fixed shelf-camera vision | Continuous gap and compliance events | Occlusion, planogram drift, per-store capex | Continuous |
| Shelf-edge sensors and ESL | Weight or stock signal per shelf | False positives, limited category fit | Real time |
| Crowd-sourced shopper apps | Real customer observations | Bias, sparse coverage, no operational loop | Ad hoc |
Best Practices & Recommendations
- Measure OSA by bay and hour, not as a store average that hides the failing aisle.
- Version the planogram; every gap comparison is only as good as the layout behind it.
- Separate gap types — empty, blocked, misplaced, phantom — because each has a different owner and fix.
- Route tasks with a service level, then track gap duration and recovery time, not detection count.
- Start with high-velocity categories, then ground-truth quarterly with manual audits to catch accuracy drift.
Limitations & Considerations
Vision sees what the camera sees: shoppers occlude bays, chillers fog, similar packaging confuses classification, and planogram drift creates false gaps until the layout updates. Production accuracy lands below controlled-test figures, so gap duration and trend matter more than any single frame. Cameras need power, mounting and network capacity, and deployments should avoid facial recognition — the target is the shelf, not the customer.
Frequently Asked Questions
Q: What counts as a good on-shelf availability rate? A: Grocery benchmarks typically target 95% or better for high-velocity categories, yet IHL’s 2025 data puts self-reported averages at 58% across large US retailers. Treat 95% as the operating goal for top SKUs and use bay-level trends to find where the gap concentrates.
Q: How accurate is AI shelf monitoring in practice? A: Detection accuracy depends on camera angle, lighting and planogram quality. Most deployments are reliable for gap detection in well-lit, fixed bays and weaker in crowded or refrigerated aisles. Validate against manual audits before tying incentives to the number.
Q: Do we need new cameras to start? A: Often not. Existing CCTV can work if the resolution and angle resolve individual facings, which typically means a dedicated view per bay rather than a wide aisle shot. Where coverage is inadequate, add fixed cameras for the highest-value categories first.
Q: How is this different from RFID? A: RFID tracks tagged units through the backroom and floor, and it is stronger for stock accuracy and replenishment. Vision reads shelf state and presentation without tags, which makes it better for planogram compliance, gap duration and the shopper-visible view. Most mature programmes combine both.
The Bottom Line: Measure the Shelf, Not the Spreadsheet
On-shelf availability is a shopper experience metric, and most retailers are still guessing at it. Continuous shelf vision replaces the weekly audit with an event stream: which bay went empty, when, for how long, and who fixed it — the difference between knowing you have a stockout problem and knowing which facing to fix before the next shopper arrives. Request a demo →
Sources: IHL Group 2025 Shelf Intelligence Report; IHL inventory distortion research, 2025; ECR Retail Loss, Managing Shelf Out-of-Stocks; AlixPartners survey via SGB Online; SPAR Group 2025 Consumer Survey.