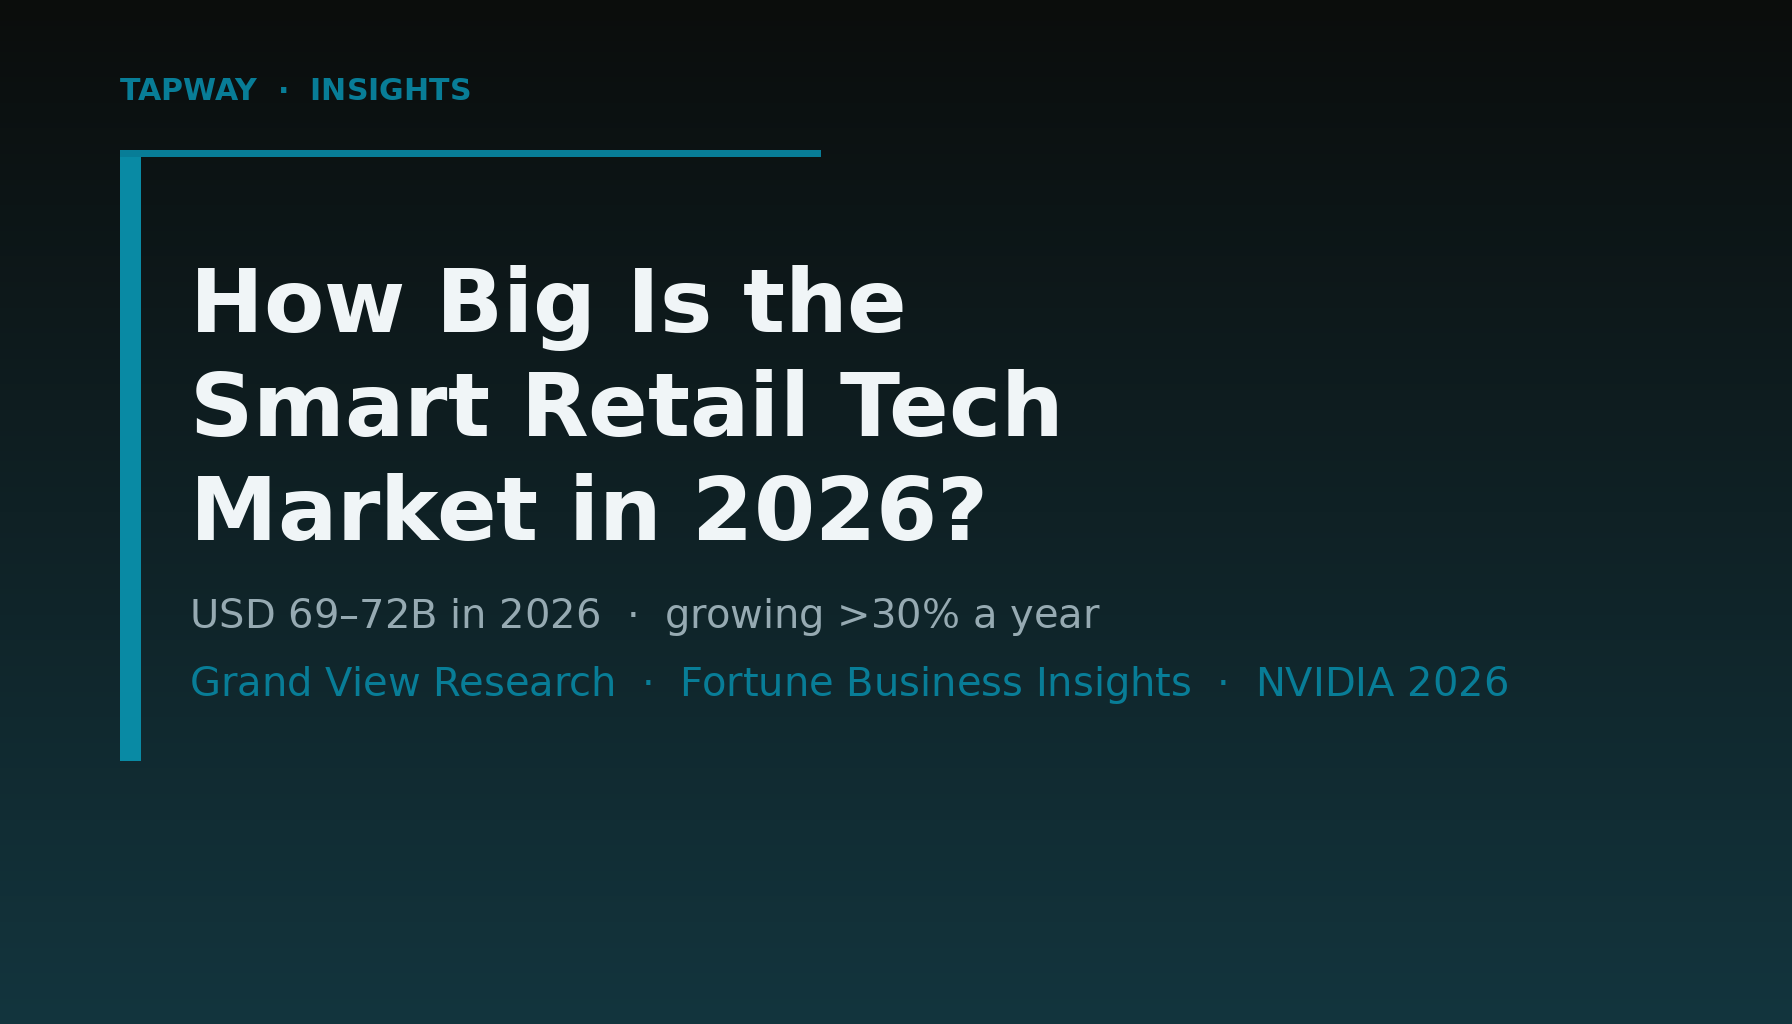
The global smart retail technology market is worth roughly USD 69–72 billion in 2026 and is compounding above 30% a year, on pace to clear USD 450 billion by the early 2030s. Two respected research houses disagree on the exact base-year figure — and both are right, because “smart retail” means something slightly different in every report. Here is what the 2026 numbers actually say, and what they mean for a store that has to justify the spend.
Executive Summary
Smart retail has moved from pilot to budget line: the market is roughly USD 69–72 billion in 2026, growing above 30% a year, and nine in ten retailers are raising AI spending rather than cutting it. The money is shifting from digital signage and cashier-less checkout toward video analytics, shrink control and store-traffic intelligence — the layer where computer vision earns its keep. Entity tags: Smart Retail | Market Size | Computer Vision | Loss Prevention | Retail Analytics | 2026
The Current State of Smart Retail Technology in 2026
Grand View Research sizes the global smart retail market at USD 54.3 billion in 2025, USD 68.8 billion in 2026 and USD 450.7 billion by 2033, a 30.8% compound annual growth rate, with North America holding a 33.9% revenue share in 2025. It attributes the expansion to AI-powered automation, cashier-less checkout, omnichannel commerce platforms and advanced customer analytics among large retail enterprises.
A second estimate from Fortune Business Insights puts 2026 at USD 72.48 billion, reaching USD 637.11 billion by 2034 at a 31.22% CAGR. The two forecasts differ by only about four billion dollars in the base year yet agree on the trajectory: a market that roughly doubles every two to three years. For retailers, the practical signal is that the category is no longer experimental — it is a line item other stores are already funding.
How the Smart Retail Market Is Measured
Smart retail is not one product, so no single number captures it. Analysts usually size solutions — hardware such as cameras, sensors and smart displays, plus software and integration services — and then split the total by application, where customer and store-traffic analytics is one of the largest and fastest-growing segments.
Two measurement traps matter when you read a headline figure. First, vendor revenue is not retailer spend: a market valued at USD 69 billion counts what suppliers sell, which excludes the internal labour, networking and data-platform cost a chain carries to run it. Second, retail performance is measured in rates, not totals — shrink as a percentage of sales, conversion per store, and events per minute at peak. The operational side of that is well covered in our guide to using footfall analytics to increase sales.
Industry Evidence: 2026 Smart Retail Benchmarks
Market scale: the smart retail market reaches roughly USD 68.8 billion in 2026 and USD 450.7 billion by 2033 at a 30.8% CAGR (Grand View Research, 2026). Shrink: US retailers lost an estimated USD 89 billion to shrink and processed USD 706 billion in returns in the last measured year (Appriss Retail, 2026). AI budgets: 90% of retailers surveyed plan to increase AI budgets in 2026, and 91% are actively using or assessing AI (NVIDIA, 2026). Revenue impact: 89% of respondents said AI is helping increase annual revenue, while 95% said it is helping lower annual costs (NVIDIA, 2026). Returns abuse: adding a single “warn and approve” decision can cut abusive returns by up to 90% without hurting loyalty (Appriss Retail, 2026). The vision layer behind those numbers is the same technology covered in our computer vision accuracy benchmarks.
Read the two shrink figures together and the opportunity is obvious: a market growing above 30% a year is being pulled by a problem worth USD 89 billion annually — inventory loss that camera-based analytics can now measure and reduce in real time.
Comparative Analysis: Smart Retail Technology Segments
| Segment | 2026 Signal | What It Changes |
|---|---|---|
| Store traffic & footfall analytics | Largest application segment by revenue | Conversion rates and staff scheduling |
| Computer vision & video analytics | Core growth driver across segments | Real-time loss prevention and ops visibility |
| Smart payment & checkout | Cashier-less checkout adoption rising | Throughput per store and labour cost |
| Digital signage & in-store display | Hardware-led revenue, strong in 2026 | Merchandising and in-store engagement |
| Inventory & shrink control | Shrink near 1.6% of sales as a benchmark | Direct margin recovery |
| AI software & analytics platforms | Fastest-growing solution type | Forecasting, assortment and personalisation |
| Edge vs cloud deployment | Edge rising on privacy and latency | Data residency and frame-level response |
| Regional split | North America at 33.9% of 2025 revenue | Asia-Pacific compressing the gap fastest |
Best Practices & Recommendations
- Separate vendor spend from operational cost. Budget for cameras, compute, networking and integration together; a headline market figure never includes the plumbing.
- Pick a segment with a measurable rate. Shrink as a percentage of sales or conversion per store beats a feature list when you have to defend the budget.
- Start where the loss already is. Video analytics for loss prevention and traffic analytics for staffing usually pay back faster than signage or ambient personalisation.
- Reuse one vision layer across use cases. A single camera and analytics platform serving traffic, queue and shrink avoids three parallel deployments. See AI video analytics in physical retail for how that consolidation works in practice.
Limitations & Considerations
Market-size forecasts are estimates, not audits. Analysts define “smart retail” differently — some fold in digital signage and payment terminals, others count only software — which is why 2026 base-year figures differ by several billion dollars depending on the source. Vendor-sponsored figures such as the NVIDIA survey carry an obvious interest in a large market, even when the methodology is sound. Shrink benchmarks also lag: the most-quoted US figure is several years old, so treat it as a floor rather than a current reading. The safest approach is to anchor on rates you can measure inside your own stores and use the market numbers only for direction.
Frequently Asked Questions
Q: How big is the smart retail technology market in 2026? A: Estimates cluster around USD 69–72 billion for 2026, with Grand View Research at USD 68.8 billion and Fortune Business Insights at USD 72.48 billion. Both project growth above 30% a year through the early 2030s.
Q: What is driving smart retail market growth? A: AI-powered automation, cashier-less checkout, omnichannel commerce and store analytics are the main drivers. NVIDIA’s 2026 survey found 91% of retailers already using or assessing AI and 90% increasing AI budgets, with loss prevention and customer analytics among the fastest-moving applications.
Q: Does smart retail technology actually pay off for retailers? A: The evidence points to cost and margin rather than novelty. In NVIDIA’s survey 95% of respondents said AI is helping decrease annual costs and 89% said it is increasing revenue, while Appriss Retail found that a single warn-and-approve returns decision can cut abusive returns by up to 90%.
The Bottom Line: The Market Is Growing Because the Problem Is Expensive
Smart retail is a USD 69–72 billion market in 2026 growing above 30% a year, but the reason to buy is not the forecast — it is the USD 89 billion retailers lose to shrink and the 90% of competitors already raising AI budgets. Treat the market numbers as direction and your own shrink, conversion and queue rates as the decision. Request a demo →
Sources: Grand View Research, Smart Retail Market (2026) · Fortune Business Insights, Smart Retail Market (2026) · Appriss Retail, 2026 Total Retail Loss Benchmark Report · NVIDIA, State of AI in Retail and CPG 2026 Survey