AI queue analytics cuts checkout wait times by measuring every queue continuously instead of sampling it: existing cameras report how many people are waiting, how long they have waited and how many leave, in real time, so tills can be opened or staff redeployed before the fifteen-minute threshold is crossed. The 2026 evidence is blunt about the cost of getting this wrong — retail now waits more than any other industry, and most of it is preventable.
Executive Summary
Queue analytics has shifted from counting heads to predicting abandonment: camera-based systems report wait time per till, queue depth and walk-aways as live operational data rather than a weekly report. Retail wait frequency is up nearly 28% since 2023, 84% of shoppers avoid a store they expect to queue in, and 39% defect or abandon when they see a line. The technology is affordable because it reuses cameras already installed for security. Entity tags: Queue Analytics | Computer Vision | Checkout Wait Time | Retail Operations | 2026
The Current State of AI Queue Analytics in Retail in 2026
Waiting is no longer seasonal. Waitwhile’s fourth annual survey of 1,000 US shoppers found physical lines in retail are now four times more common than in any other industry — more than pharmacies, restaurants and airports — with long waits up nearly 28% since 2023. Patience thinned: only 75% of consumers will wait fifteen minutes, down from 81% a year earlier.
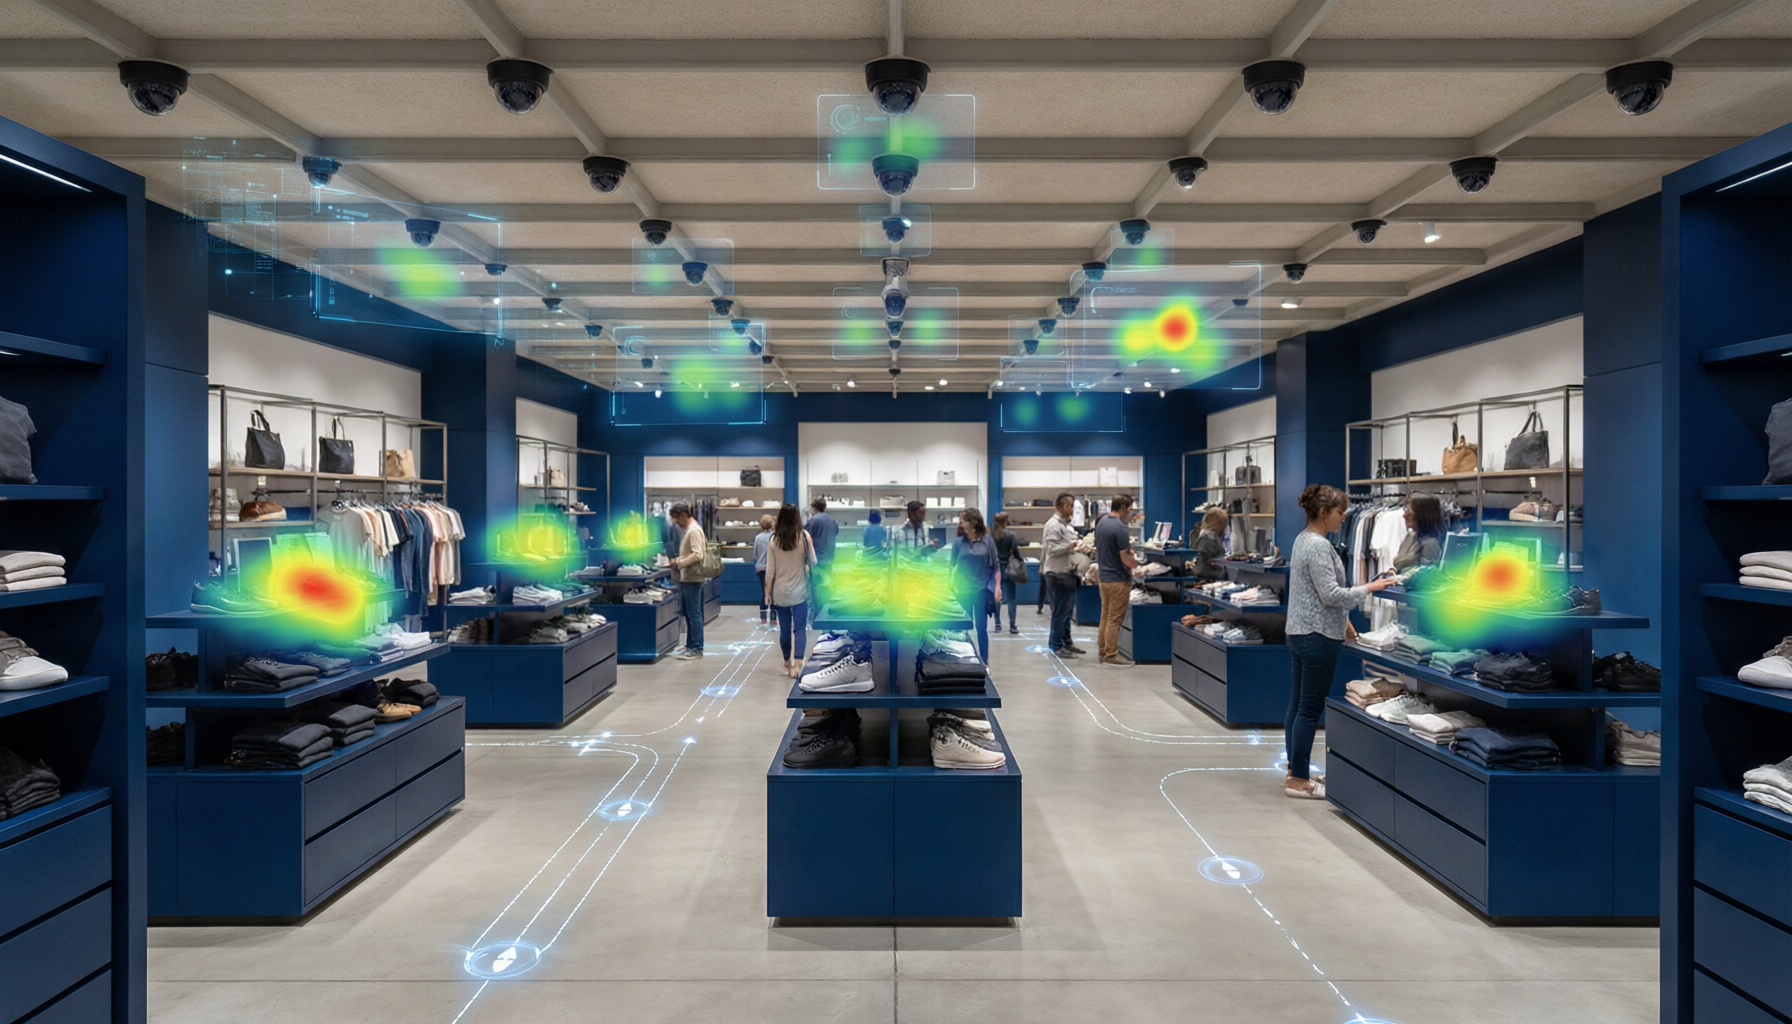
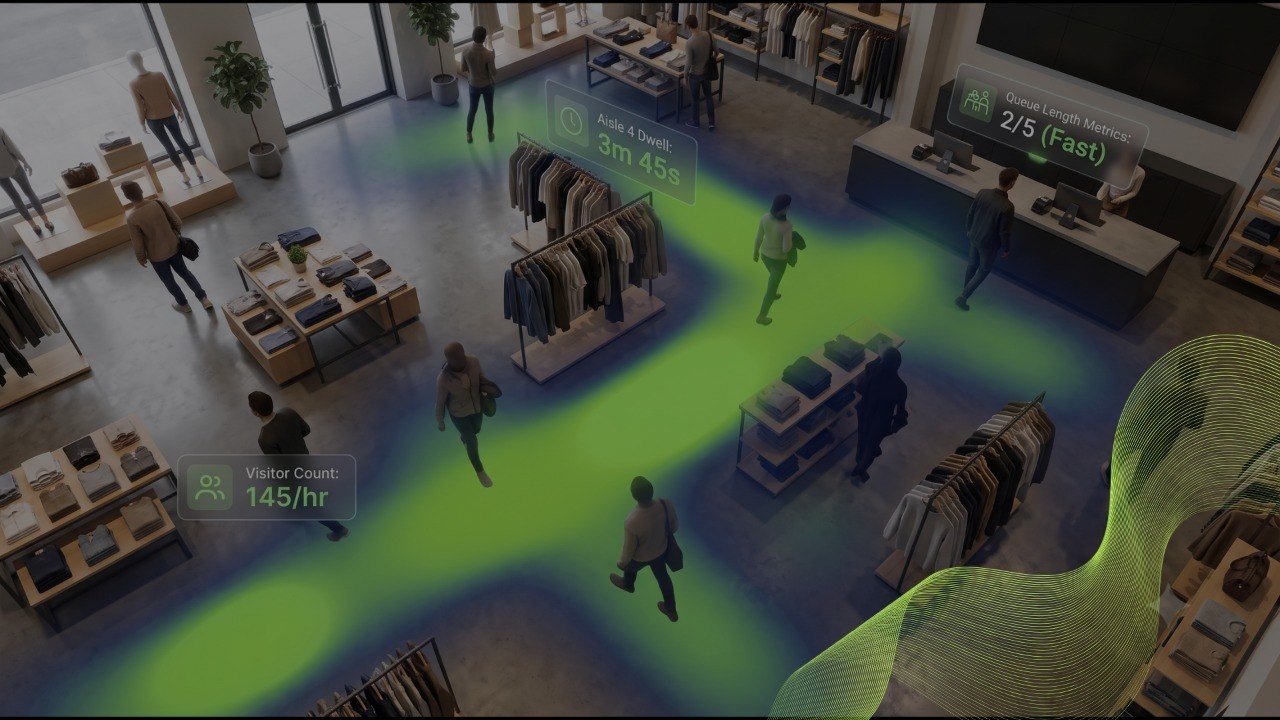
That gap is what queue analytics closes. Traditional measurement counted people once an hour and reported last week; vision-based analytics turn the same task into an event stream — every person entering a checkout zone, every second they stand in it, every exit that ends without a transaction. Paired with the footfall data retailers already collect, it separates “we are busy” from “we are badly staffed”.
The market agrees. Grand View Research sizes queue management software at USD 944.6 million in 2026, reaching USD 1.22 billion by 2030 at a 6.4% CAGR — modest growth for a category now bundled into smart retail platforms rather than sold as ticket dispensers.
How Checkout Wait Time Is Measured
Manual sampling — a staff member with a clipboard at fixed intervals — is defensible but near-blind: a queue that peaks between rounds never appears in the data. Queue sensors (thermal counters, ticket dispensers, beam breaks) capture presence at a fixed point but cannot tell you whether a person joined, bought, or walked out.
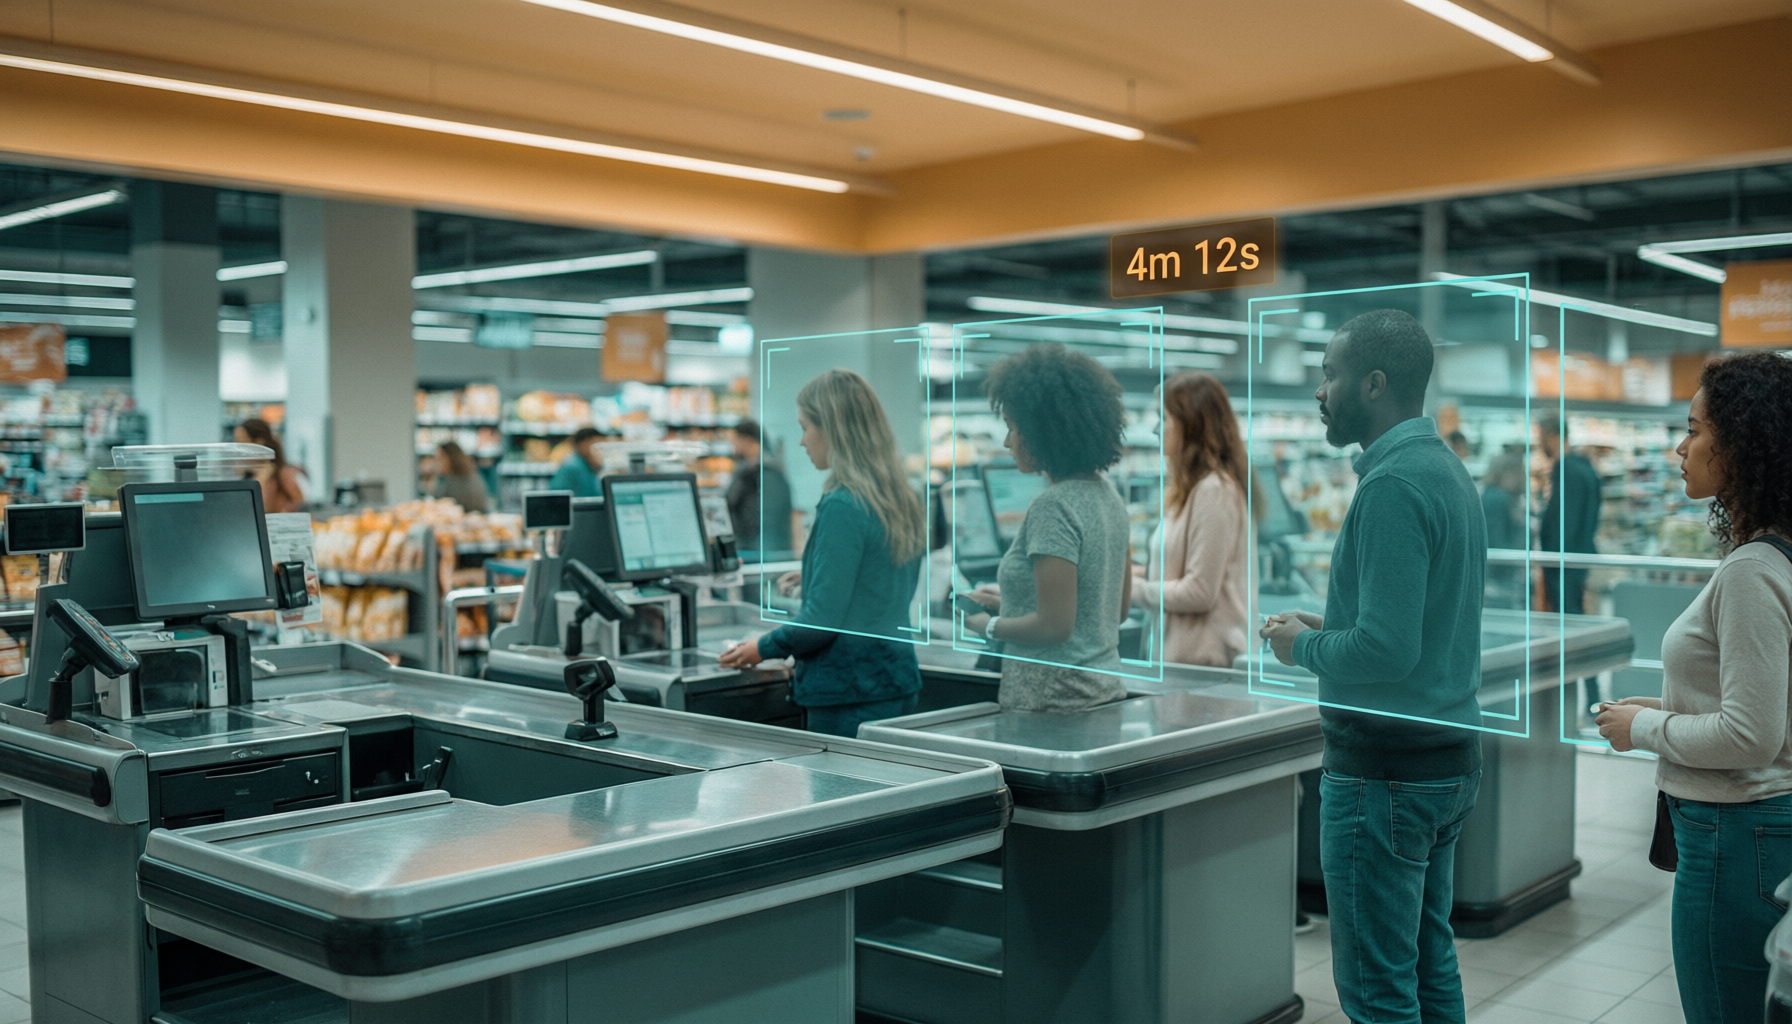
AI video analytics works differently: define a polygon over the checkout area and the model detects people, assigns tracks, and logs join and leave events against that zone. From those events a store derives queue depth over time, median and 90th-percentile wait, service rate per till and abandonment rate — the numbers a time-and-motion study would compute, at every till, all day. Crowded-scene tracking is the real constraint, which is why detection benchmarks matter more than the dashboard.
Industry Evidence: 2026 Queue Benchmarks
Wait frequency: long waits in retail are up nearly 28% since 2023 and 4x more common than in any other industry (Waitwhile, 2025). Tolerance: only 75% of consumers will wait fifteen minutes, down from 81% in 2024, and persistent annoyance rose 167% year on year (Waitwhile, 2025). Revenue at risk: 84% of shoppers avoid a business when they anticipate a wait and 39% switch to a competitor or abandon the purchase at the sight of a line (Waitwhile, 2025). Digital preference: 65% prefer to book an appointment and 50% favour a virtual queue, with 45% still shopping while they wait and shoppers 5x more likely to tolerate 30 minutes once out of the physical line (Waitwhile, 2025). AI impact: 41% of retail and CPG respondents credit AI with better customer service, inside a cohort where 91% are using or assessing AI and 90% are raising budgets in 2026 (NVIDIA, 2026).
Comparative Analysis: Three Ways to Measure a Checkout Queue
| Approach | What It Actually Captures | Where It Falls Short |
|---|---|---|
| Manual clipboard sampling | Snapshots of queue length at fixed intervals | Misses peaks; no wait-time distribution |
| Mystery shopping | Perceived experience, staff scripting | A handful of visits per store per month |
| Thermal / IR counters | Presence at a fixed point | Cannot separate joining from buying or leaving |
| Ticket dispensers | Issued and called numbers | Only queues the store already tickets |
| Beam-break sensors | Crossing events at a threshold | No direction or dwell beyond the beam |
| Queue-only CV appliance | Depth, wait, abandonment in that zone | Blind outside the checkout area |
| CV on existing CCTV | Queue, dwell, service rate network-wide | Depends on placement and lighting |
| CV plus POS data | Wait time tied to basket and conversion | Needs integration and store mapping |
Best Practices & Recommendations
- Instrument the queue before hiring for it. Two weeks of measured wait distribution usually shows the problem is four peak hours a week, not a roster-wide shortfall.
- Measure abandonment, not just length. A short queue customers refuse to join is worse than a long one they tolerate; the leave-without-transaction event maps to revenue.
- Alert below the tolerance curve. If 75% will wait fifteen minutes, trigger at eight to ten so a till opens before patience breaks.
- Reuse the camera layer you own. Queue zones, occupancy and yard activity can share one edge appliance, keeping the marginal cost of each new use case low.
- Validate against a human count for one week. Parallel counting catches calibration errors before the figure becomes a KPI payroll is planned around.
Limitations & Considerations
Queue analytics is only as good as its geometry. A camera mounted behind the tills cannot see the line in front of them, and a badly drawn zone reports phantom queues all day. Overlapping bodies still degrade tracking, so 90th-percentile wait is directional until validated on site. Privacy duty shapes the design too: the defensible architecture counts people without identifying them, retains no faces and stores events rather than footage. The surveys cited here come from companies selling queue software and AI infrastructure; their methods are disclosed, but treat them as direction, not a substitute for a baseline in your own stores.
Frequently Asked Questions
Q: What is AI queue analytics? A: AI queue analytics applies computer vision to existing cameras to detect people in a checkout zone, track how long each person waits and log walk-aways. It outputs queue depth, median and 90th-percentile wait, service rate per till and abandonment rate as live data instead of periodic manual counts.
Q: How accurate is camera-based wait time measurement? A: Accuracy depends on placement, lighting and crowd density. A properly calibrated zone-based system tracks joins and exits reliably in normal conditions, but overlapping bodies in dense queues break track continuity, so most deployments validate against a one-week human count before the figures become operational KPIs.
Q: How long will customers wait before leaving a queue? A: Waitwhile’s 2025 survey of 1,000 US shoppers found only 75% will wait fifteen minutes, down from 81% in 2024; 39% switch to a competitor or abandon the purchase when they see a line, and 84% avoid a business entirely if they anticipate waiting.
Q: Does queue analytics need new cameras? A: Usually not. Most deployments run on existing CCTV coverage that sees the checkout area at a usable angle. The common failure mode is placement rather than hardware — a camera behind the tills cannot measure the line in front of them.
The Bottom Line: The Queue Is a Measurable Line Item
Retail waits are up nearly 28% since 2023, 84% of shoppers avoid a store they expect to queue in, and 39% leave for a competitor at the sight of a line — which makes every unmeasured queue an unmeasured revenue leak. Camera-based queue analytics closes it by turning a weekly guess into a live wait-time number per till, at a marginal cost that is mostly software. Request a demo →
Sources: Waitwhile, The State of Waiting in Line 2025 (1,000 US consumers) · NVIDIA, State of AI in Retail and CPG 2026 Survey · Grand View Research, Queue Management System Market Report (2026)