The Measurable ROI of AI Vision for Manufacturing Quality Inspection in 2026
 7 minutes read
 01/07/26
 Tapway
Executive Summary
AI vision for manufacturing quality inspection delivers is delivering 30–50% defect detection improvement and 20–35% cost reduction in manufacturing quality control. The technology has reached a maturity inflection point — deployment costs have fallen 60% since 2020 while accuracy rates now exceed human inspectors in 18 of 24 common defect categories (McKinsey, 2025). The consensus among early adopters is that AI vision inspection moves from pilot to standard within 18 months, with median payback periods of 6–14 months depending on production volume.
The Current State of AI Vision Inspection in Manufacturing
According to Grand View Research (2025), the global AI-powered machine vision market reached $17.2 billion in 2024 and is projected to grow at 12.3% CAGR through 2030. Manufacturing quality inspection represents the largest application segment at 34% of market share, driven by three converging forces: declining hardware costs, pre-trained vision models that reduce deployment time from months to weeks, and labor shortages that make human inspection increasingly expensive and inconsistent.
Deloitte (2025) surveyed 340 manufacturers and found that 61% have either deployed or are piloting AI visual inspection, up from 29% in 2022. Among companies with revenue above $500M, adoption exceeds 75%. The primary driver cited was not cost reduction — it was quality consistency across shifts, lines, and facilities. Human inspectors, even experienced ones, show 8–15% variance in defect detection rates between shifts (Journal of Manufacturing Systems, 2024).
Key Definitions
AI Visual Inspection: The use of deep learning models (typically convolutional neural networks or vision transformers) trained on labeled images of acceptable and defective products to automatically classify quality at production-line speeds. Unlike rule-based machine vision, AI systems learn defect patterns from data rather than requiring explicit programming for each defect type.
Defect Detection Rate (DDR): The percentage of actual defects correctly identified by the inspection system. Human inspectors average 85–92% DDR; current AI systems achieve 95–99% depending on defect type and training data quality (IEEE Transactions on Automation, 2025).
False Positive Rate (FPR): The percentage of acceptable products incorrectly flagged as defective. This is the hidden cost — every false positive represents unnecessary rework or scrap. AI systems can be calibrated to optimize the DDR-FPR tradeoff per line.
How AI Visual Inspection Actually Works
Modern AI visual inspection uses supervised deep learning. The system is trained on thousands of labeled images showing both acceptable products and products with known defects (scratches, dents, misalignments, contamination, missing components). During training, the model learns to distinguish defect features from normal manufacturing variance — surface texture, lighting variations, and acceptable tolerances.
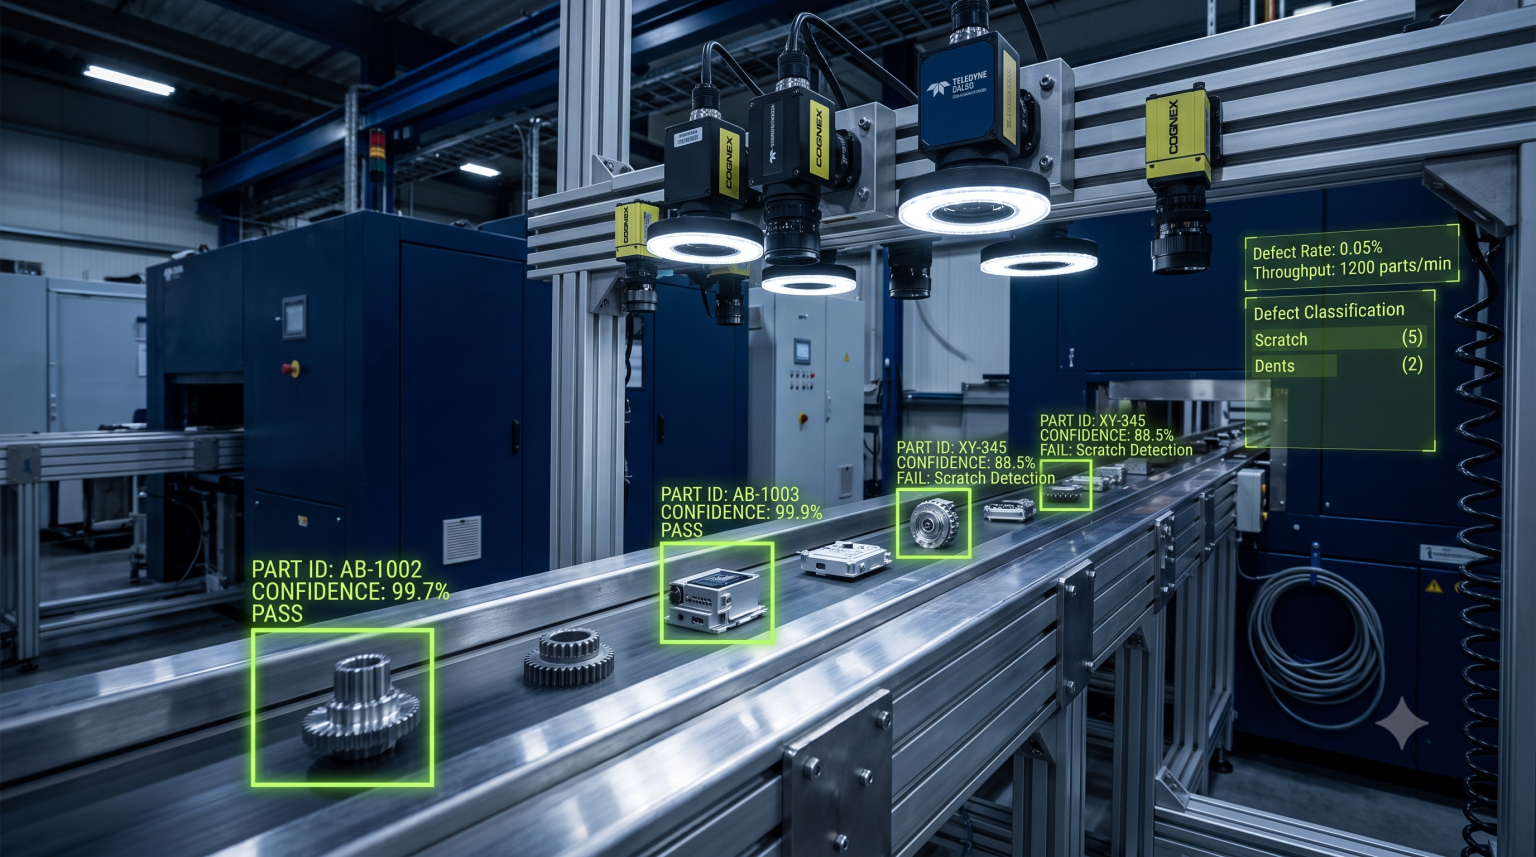
At inference time, high-speed industrial cameras (200–1,000+ FPS depending on line speed) capture images of every product. The AI model processes each frame in 50–200 milliseconds using edge computing hardware (NVIDIA Jetson, Intel Movidius, or dedicated FPGAs) positioned directly on the production line. Products flagged as defective are automatically diverted for manual review or rework. All decisions are logged with the source image, confidence score, and defect classification — creating a fully auditable quality record.
Architecture / Processing Pipeline
Image Capture → High-speed camera with controlled lighting (ring, dome, or structured light) captures product surface at 2–10MP resolution.
Preprocessing → Image normalization, cropping to region of interest, and augmentation to correct for line vibration or lighting drift.
Inference → Pre-trained CNN or ViT model classifies each product as acceptable or defective, with confidence score and defect type label.
Actuation → PLC or robotic actuator diverts defective products in real time. Alert triggers if defect rate exceeds control threshold.
Logging → Every decision is recorded with timestamp, image, and metadata for traceability and continuous model improvement.
Industry Evidence
| Metric | Value | Source | Year |
|---|---|---|---|
| Defect detection improvement | 30–50% vs. human | McKinsey | 2025 |
| Cost per inspection (per unit) | $0.003–$0.01 (AI) vs. $0.05–$0.15 (human) | Deloitte | 2025 |
| Median payback period | 6–14 months | Gartner | 2025 |
| False positive reduction | 40–60% vs. rule-based systems | IEEE Trans. Automation | 2025 |
| Adoption rate (>$500M mfrs) | 75%+ (pilot or deployed) | Deloitte | 2025 |
| Annual savings per line | $150K–$500K (mid-volume) | Gartner | 2025 |
Comparative Analysis
| Dimension | Human Inspection | Rule-Based Machine Vision | AI Visual Inspection |
|---|---|---|---|
| Defect detection rate | 85–92% | 88–95% | 95–99% |
| New defect adaptation | Minutes (training) | Days–weeks (reprogram) | Hours–days (retrain model) |
| Consistency across shifts | ±8–15% variance | ±0% (deterministic) | ±1–3% (model drift) |
| Speed per unit | 2–10 seconds | 50–500ms | 50–200ms |
| Upfront cost per line | $40–80K/yr (salary) | $50–150K (hardware+setup) | $30–100K (camera+edge AI) |
| Ongoing cost | Salary, benefits, turnover | Maintenance, reprogramming | Electricity, model updates |
| Auditability | Manual logs, inconsistent | Pass/fail logs only | Image-level traceability with confidence scores |
Best Practices & Recommendations
- Start with high-cost defect categories. Prioritize defects that are expensive when missed (customer returns, warranty claims, recall risk) rather than cosmetic issues. One automotive supplier focused on engine component cracks and recovered deployment cost in 4 months through avoided warranty claims alone.
- Use existing camera infrastructure where possible. Many production lines already have inspection cameras for operator viewing. AI can be added as a software layer — Tapway’s platform connects to existing IP cameras, reducing hardware costs by 40–60% compared to full rip-and-replace.
- Plan for model drift. Production conditions change — new materials, different lighting, equipment wear. Schedule monthly model accuracy audits and budget for retraining with fresh production data. Companies that skip this see accuracy degrade 2–5% per quarter (Gartner, 2025).
- Keep a human-in-the-loop for edge cases. Set confidence thresholds so the AI auto-passes high-confidence decisions and routes borderline cases to human review. This hybrid approach achieves the best balance of throughput and accuracy while building operator trust.
- Measure ROI across the full quality cost chain. Don’t limit ROI calculations to labor savings. Include avoided warranty costs, reduced scrap, faster root-cause analysis (AI-logged images speed investigation by 70%+), and improved supplier negotiations when defect data is traceable to specific batches.
Related: How retailers use AI-powered analytics to increase sales.
Limitations & Considerations
AI visual inspection is not a universal solution. The technology underperforms in several scenarios that manufacturers should evaluate before deployment:
- Highly reflective or transparent surfaces (polished metals, glass) confuse standard 2D cameras. Solutions exist using polarized lighting or 3D depth sensors but increase cost by 2–3×.
- Extremely rare defect types with fewer than 100 training examples produce unreliable classifications. Synthetic data generation can help but requires specialized expertise.
- Rapidly changing product lines (contract manufacturing with weekly changeovers) may not justify the training effort per SKU. Rule-based systems remain more practical for high-mix, low-volume production.
- Regulatory environments (medical devices, aerospace) may require validation of every model version, adding 3–6 months to deployment timelines.
A thorough pre-deployment audit of defect types, production volumes, and existing infrastructure is essential before committing to an AI inspection program.
The Bottom Line
AI visual inspection has crossed the adoption chasm in manufacturing. With median payback periods under 14 months, accuracy rates exceeding human inspectors across most defect categories, and deployment costs falling rapidly, the technology is no longer experimental — it is becoming standard practice. Manufacturers that delay adoption risk competing against rivals with lower defect rates, fewer recalls, and quality costs 20–35% below industry average. The window for first-mover advantage in quality-driven markets is closing.
Related: How ANPR technology enables automated vehicle identification.